The customer service metrics that matter: CSAT, NPS, CES, and FCR
Posted on November 10, 2026

Article
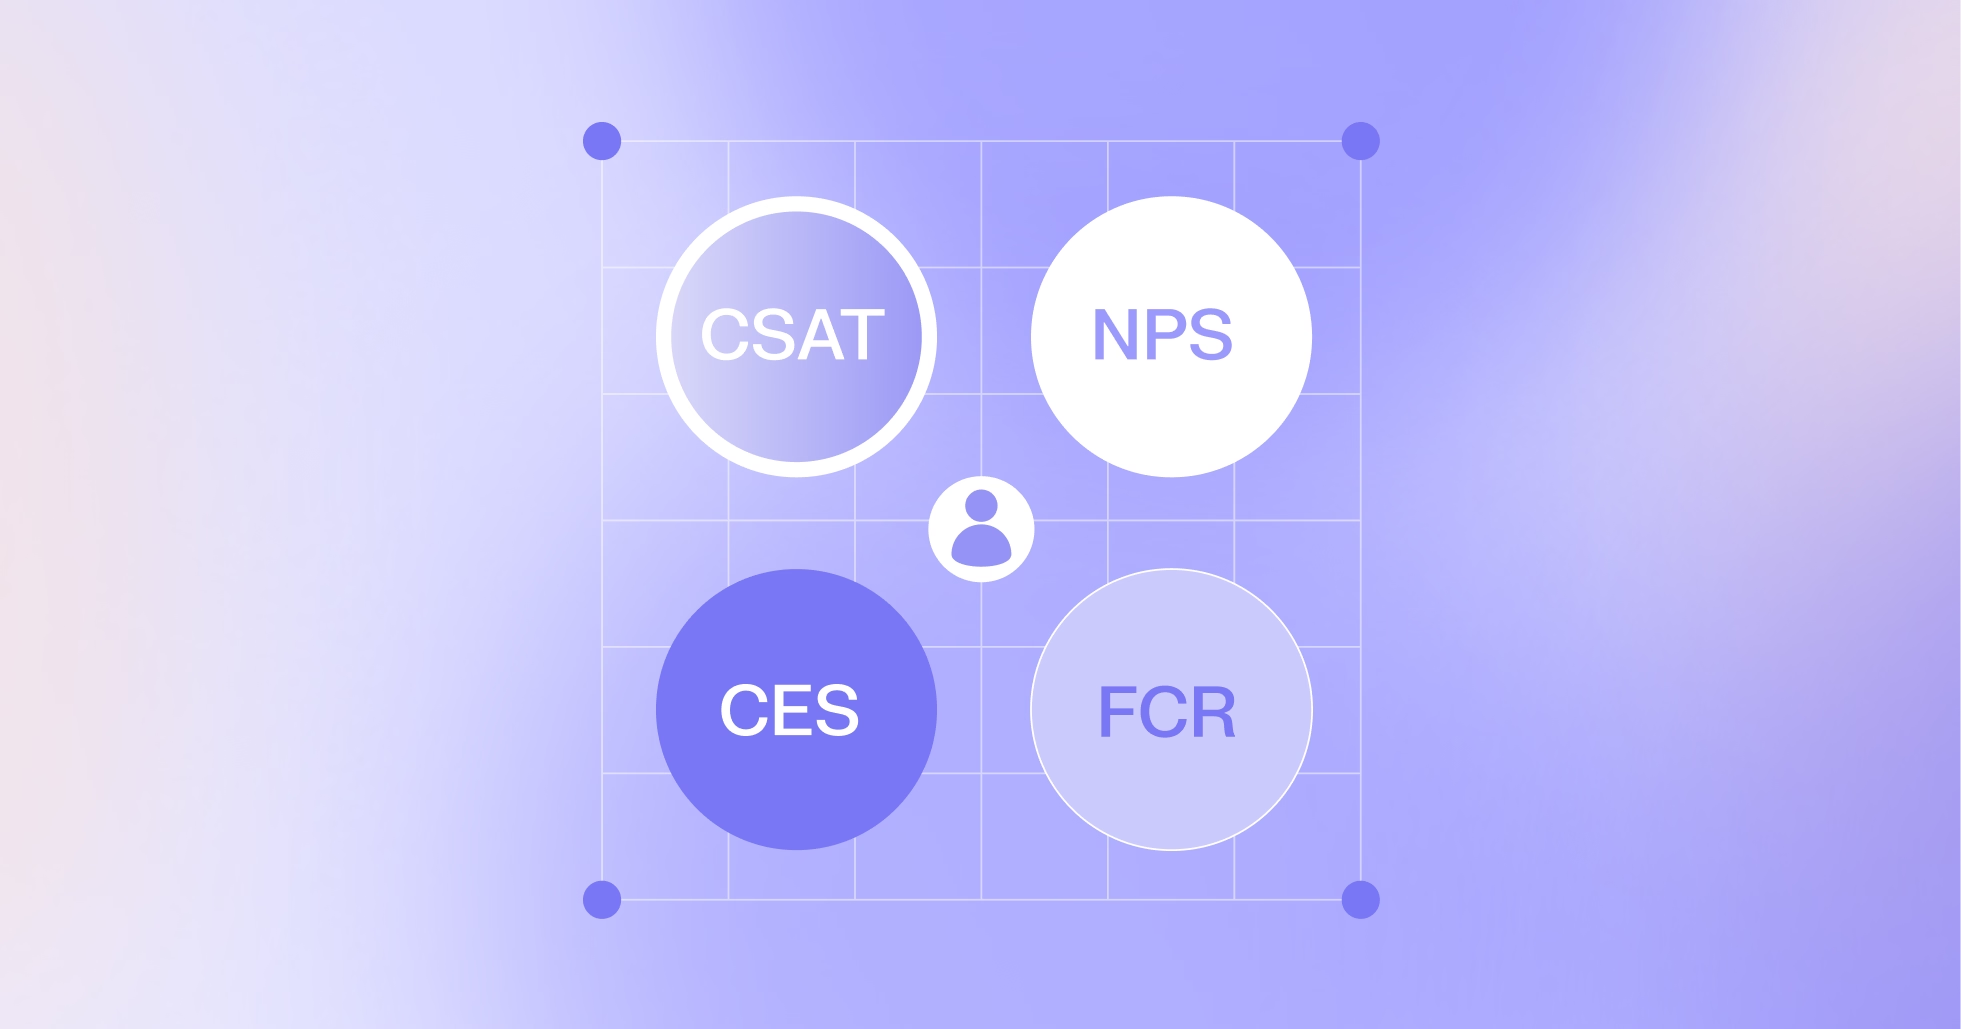
Support teams can track dozens of customer service metrics, but most leadership conversations still come back to four. CSAT, NPS, CES, and FCR each answer a separate question about how service is going, and treating them as one blended verdict is how a reporting deck ends up saying very little.
Here is the short version of what each one covers.
- Customer Satisfaction (CSAT) shows how a customer rated one interaction.
- Net Promoter Score (NPS) shows how strong the wider relationship with your company is.
- Customer Effort Score (CES) shows how much work the customer had to do to get resolved.
- First Contact Resolution (FCR) shows whether the issue was closed without a second contact.
Read on its own, any of these can move for reasons that have nothing to do with service quality. First contact resolution can climb while customers are working harder than ever to reach that resolution. This guide gives each metric one job, one calculation you can defend in a review, and one companion measure that keeps it honest.
What does each customer service metric measure?
Customer service KPIs get grouped together on the same dashboard, which makes it easy to assume they are interchangeable. These four are not. Two of them ask about a single conversation, one asks about the whole relationship, and one asks whether the problem actually went away.
- CSAT works at the interaction level and captures how satisfied someone felt right after a specific contact.
- CES also works at the interaction level, but it measures the amount of work the customer had to put in to get an answer.
- NPS works at the relationship level and asks how likely a customer is to recommend your company, which support influences without owning outright.
- FCR is an operational count of whether one contact closed the issue with no return visit inside your reopen window.
Where each number comes from matters as much as what it says. CSAT and CES are asked right after an interaction while the experience is fresh. FCR is calculated from your ticket data rather than surveyed at all. NPS arrives through a periodic relationship survey, often quarterly, and is never attached to one conversation. That timing gap is why a rough week in the queue can pull CSAT down straight away while NPS barely moves.
How do you calculate and read CSAT?
CSAT is the percentage of people who rated an interaction positively on a scale you have defined, asked shortly after the contact ends. The math is simple. Divide positive responses by total responses, then multiply by 100.
Here is an illustrative example. You send 400 surveys after chat conversations, 120 people reply, and 96 of them pick a 4 or a 5 on a five-point scale. Your CSAT is 80 percent.
However, that number means nothing without three pieces of context traveling beside it.
- The question you asked, since wording changes how people answer.
- The scale used and which ratings you counted as positive.
- The response count, because 96 replies out of 120 tells a very different story than 96 out of 4,000.
Two things quietly impact the result as well. Response bias means the delighted and the furious answer while everyone in the middle ignores the survey. Sampling bias means you may only be surveying one channel or one shift. Both narrow what the score can prove, so read CSAT next to FCR or CES.
Let’s make one more thing clear. There is no universal good CSAT score. Industry averages come from different questions, scales and populations, so they rarely describe your operation. Track your own trend and investigate the movement. The same rule applies to FCR, NPS and CES.
Is NPS a customer service metric?
Not really, and that distinction protects your team. NPS measures loyalty to your company as a whole. Support has real influence over it, but support does not control it.
The calculation runs on a relationship survey that asks how likely someone is to recommend you, usually on a zero-to-ten scale. Scores of 9 and 10 count as promoters, 7 and 8 are passives, and 0 through 6 are detractors. Subtract the percentage of detractors from the percentage of promoters, and you have your NPS, which can land anywhere from minus 100 to plus 100. Passives are counted in the total but do not add points either way.
Now think about what a customer has in mind when they answer that question. Their last support conversation is in there somewhere, sitting alongside plenty of things your CX team never touched.
- Whether the product does what they hoped it would.
- What they pay for it and how they feel about that price.
- Billing, shipping, onboarding, and every other part of the experience.
- News about your company, or a friend's opinion of it.
So when NPS slides, the honest first question is which of those moved. Read it against CSAT and retention data before assigning the drop to the support queue.
The cleanest way to hold the two apart is by scope. CSAT and NPS answer different questions. CSAT asks how one conversation went. NPS asks how the relationship is holding up. Both are worth tracking. Neither is a substitute for the other, and reporting only NPS to your leadership team hides the interaction-level detail that tells you what to fix next week.
What does customer effort score measure?
Customer Effort Score (CES) captures how much work a customer had to do to get their issue resolved. It is one question, asked after the interaction, usually along the lines of how easy the company made it to handle their request.
Effort is the part CSAT tends to miss. Someone can rate an interaction 5 out of 5 because the agent was patient and kind, having spent 40 minutes and three transfers getting there. The satisfaction score looks great, but the experience was exhausting, and that is what the customer remembers when renewal comes around.
A few practical rules keep CES usable.
- Write one version of the question and stick with it, because small wording changes shift the results.
- Pick a scale and leave it alone, since CES conventions differ between teams and some run 1 to 5 while others run 1 to 7.
- Be clear about which direction is good, as some scales treat a high number as low effort and others do the reverse.
- Ask at the point the interaction closes rather than days later.
CES is important because it flags quiet frustration before it turns into churn. Pair it with FCR or repeat-contact rate so you can see whether high effort came from the issue bouncing between people, or from one long conversation that finally got there.
How do you count first contact resolution?
First contact resolution (FCR) is the share of eligible cases that got resolved on the first contact, with no repeat from that customer inside a reopen window you have set in advance. Divide resolved-first-contact cases by eligible cases, and you have the score.
The formula is the easy part. FCR is the metric most likely to be quietly different in two reports from the same company, because three decisions sit underneath it and teams rarely write them down.
- The reopen window. A 24-hour window will always produce a healthier score than a 7-day one, since a customer who comes back on day four never counted against you.
- Transfers and channels. Decide whether a chat that moves to email is still one contact or two, and whether an internal handoff breaks the streak.
- The definition of resolved. Answering a question is not the same as fixing a problem, and marking a ticket closed is not the same as either.
Eligibility deserves the same care. Cases that were never going to close in one contact, such as a refund waiting on a supplier or an outage the customer reported early, will drag the number down for reasons no agent controls. State which case types are in scope and keep that list steady, otherwise your trend line measures your definitions rather than your service.
Here is an illustrative example of how that looks with real numbers.
Your team handles 2,000 tickets in a month. You exclude 350 of them as ineligible, since they were waiting on a third party or reported a known outage. That leaves 1,650 eligible cases. Of those, 1,155 closed on the first contact with no return from the customer inside your 7-day reopen window.
Divide 1,155 by 1,650, and your FCR is 70 percent.
Now shorten the reopen window to 24 hours. Cases that came back on day three stop counting against you, and the same month can report closer to 75 percent. Nothing about the service changed. Only the rule did, which is why the window belongs in the report next to the number.
Read FCR beside CSAT or CES. A one-and-done close that left the customer worn out or unhappy is not the outcome the score is meant to represent. Together they tell you whether fast also meant good.
Which metrics should you track together?
Every metric in this guide has a blind spot, and every blind spot is covered by a second number. Reading them in pairs is what turns a dashboard into something you can act on, because the gap between two scores usually points straight at the problem.
Three pairings do most of the work.
- FCR with CES. A high FCR says issues are closing on the first contact. CES says whether that took the customer 3 minutes or 30. When resolution stays flat and effort climbs, the work has shifted onto the customer.
- Deflection rate with CSAT. More automated handling looks like progress on its own. Watching satisfaction alongside it shows whether customers are being helped or simply held away from a human.
- Handling time with repeat-contact rate. Shorter conversations can mean genuine efficiency. They can also mean agents are closing tickets that come straight back tomorrow, which moves the cost rather than removing it.
Then there is the pairing for the boardroom. NPS moves slowly and reflects the whole company, so read it against CSAT and retention before crediting or blaming support for the shift.
Write down the second metric next to each headline number in your reporting, and agree in advance what a divergence between the two means. When FCR rises and CES worsens, everyone should already know that is a signal to look at how the resolution happened, not a reason to celebrate.
How does AI change these metrics?
AI handling changes who or what answers a contact, and that quietly changes what your metrics count. When AI agents resolve the routine questions, the conversations that still reach a person are the harder ones. Human CSAT can dip and human handling time can rise while the customer experience overall gets better. A blended score moves for structural reasons, not because your team got worse at the job.
The first fix is vocabulary. Three terms get used as if they mean the same thing, and they do not.
- Deflection counts conversations resolved without a human agent involved.
- FCR counts issues closed on the first contact, whether AI or a person handled it.
- Containment counts conversations that stayed inside the automated channel, which is not the same as being solved there.
Relabelling one as another creates a reporting error that survives for quarters. Keep the original term and its denominator wherever the number came from.
The second fix is definition. Before you compare AI and human results, agree on four things and write them down.
- Who counted as the handler when both AI and a person touched the conversation.
- What triggers a transfer, and whether a transfer ends the first contact.
- What event marks the issue as resolved.
- How long the reopen window runs.
Reporting FCR split by AI and human handling, rather than as one figure, keeps the two readable as volumes shift between them.
From there it becomes an investigation rather than a guess. Decagon's Watchtower connects a score back to the conversations behind it, so a CSAT drop can be traced to specific transcripts and flagged patterns. Experiments tests a change against a stable control group on live traffic, with a p-value threshold you set, so you can tell a real improvement from normal week-to-week noise.
Chime shows what this looks like when efficiency and experience are measured side by side. The team assessed vendors on three things at once: response accuracy, automation rate, and member satisfaction tracked through support NPS. Chime now reports 70 percent chat and voice resolution across both channels, a support NPS of 30, and a 60 percent decrease in customer support costs. Worth noting that they scoped the loyalty measure to support rather than borrowing the company-wide NPS, which keeps the number answerable by the team that owns it.
Build a scorecard that drives decisions
Most service dashboards report what happened. A scorecard worth keeping tells you what to do next, and that comes from giving every metric one job and one companion rather than a place on a long list.
Four rows will carry the weight.
- CSAT owns interaction satisfaction. Read it against FCR or CES.
- NPS owns the wider relationship. Read it against CSAT and retention data.
- CES owns customer effort. Read it against FCR or repeat-contact rate.
- FCR owns resolution. Read it against CSAT or CES.
Next to each row, record the decisions that make the number mean anything. The survey question and scale for CSAT and CES. The reopen window and eligible case types for FCR. The survey cadence for NPS. Then add one line stating what a gap between the pair should trigger, so a divergence starts an investigation instead of a debate.
Review it monthly, look at movement rather than benchmarks borrowed from elsewhere, and split every score by AI and human handling so the picture holds as volumes shift between them.
See how Decagon measures AI and human handling side by side, with each score traceable to the conversations behind it.

Start improving your workflow with Decagon
With Decagon, CX teams don’t have to guess whether a change will improve CSAT or deflection. They can move quickly, measure what matters, and act on what works.
Join us
There are very few places where you can prototype with frontier LLMs, ship to production in days, and watch users engage with the systems you built—all while owning the entire stack, from intent parsing and tool usage to API integration and observability. This role at Decagon is one of those places.
From my own experience working across both agent development and broader engineering initiatives at Decagon, I’ve seen firsthand how uniquely impactful this work can be. Whether I’m building intelligent workflows for customers or designing infrastructure that supports our agent platform, it’s rare to find an environment where the work transitions from concept to production within days, actively powering user experiences and transforming how businesses operate.
If you’re looking for a role where you can:
- Build at the frontier of LLMs, automation, and user interaction
- Deploy AI agents that solve high-value business use cases across industries including retail, travel and hospitality, fintech, edtech, and more
- Work directly with customers on high-impact use cases
- Ship fast, iterate constantly, and own your work from idea to production
- Join a fast-moving, collaborative team solving real-world challenges with AI
We’d love to hear from you!




The AI concierge for every customer.